
The U.S. truckload market ratcheted tighter into the beginning of this week, with closing spreads between contract and spot rates and multiple major trucking markets rejecting more than 7% of outbound shipments. However, there’s still no clear ‘melt-up’ or cascade toward meaningfully higher rates compared to conditions during the holiday retail peak season.
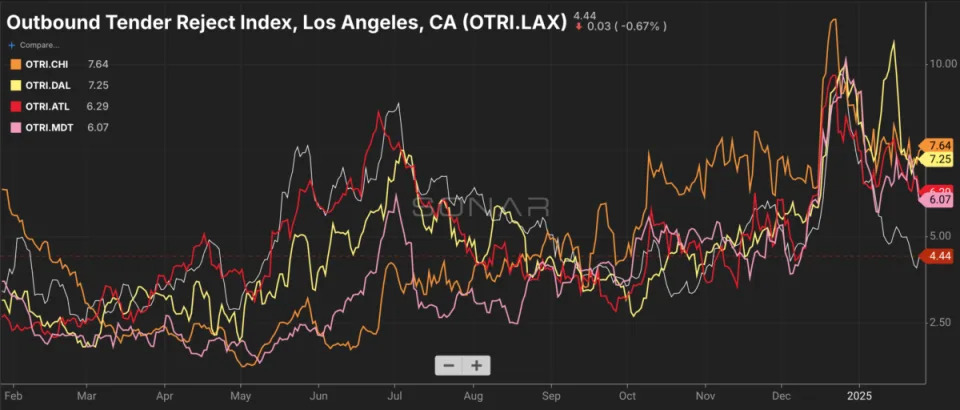
(The Outbound Tender Reject Index measures the percentage of electronically tendered truckload shipments rejected by carriers and serves as a proxy measure of the relative balance between the supply of trucking capacity and volume demand. Chart: SONAR. To learn more about SONAR, click here ).
Notably, Los Angeles has softened compared to the rest of the country; while the national average tender rejection rate is still in nominally inflationary territory at 7.11%, LA’s outbound rejections have cooled to just 4.44%. Because Los Angeles is such an important origin for retail imports, it’s considered an ‘upstream’ market that influences markets further inland. If LA is soft compared to the national average, it implies that national average tender rejections will also come down.
But Dallas, rejecting 7.25% of its outbound truckload shipments, and Chicago, rejecting 7.64% of its outbound truckload shipments, are both tighter than the national average. Both markets experienced recent weather-related spikes in tender rejections and are still loosening back up, but Chicago in particular looks like it could stay tighter for longer.
Recent results from publicly-traded trucking carriers reinforces the thesis that while the trucking market is improving for carriers, progress in tightening capacity and rising rates is halting and gradual.
Knight-Swift’s 2024 fourth-quarter earnings report provides a revealing snapshot of the current U.S. trucking market , particularly within the truckload segment, and it’s especially illuminating to compare it with Knight-Swift’s less-than-truckload (LTL) business. The company’s LTL unit showcased a robust 20.2% year-over-year revenue increase, reaching $279 million. This growth was driven by a 13% rise in daily shipments and a 6.6% boost in revenue per shipment, excluding fuel.
If LTL experienced positive trends in volume and pricing, truckload (TL) was the opposite: soft, with falling volumes and rates. Knight-Swift reported a 4.4% year-over-year decline in TL revenue, which fell to $1.1 billion. This downturn occurred even as the company managed to increase revenue per tractor by 1.7%, thanks in part to a 6% reduction in the number of tractors in service. The company’s strategic move to rationalize its tractor and trailer counts aimed to improve fleet utilization, resulting in a 2.4% increase in loaded miles per tractor. Despite these efficiency gains, revenue per loaded mile slightly decreased by 0.7%, a 1% sequential improvement from the third quarter of 2024.
In other words, while Knight-Swift reduced its fleet count in order to increase asset utilization and ultimately lower its TL adjusting operating ratio to 92.2%, total loaded miles run by the fleet decreased. Because pricing per loaded mile fell, total truckload revenue dropped.
The financial results highlight a mixed landscape for the trucking industry. While the LTL sector is thriving, driven by increased shipments and higher yields, the TL segment is grappling with reduced revenue despite better asset utilization. This dichotomy underscores the broader market dynamics at play, where LTL remains capacity-constrained in multiple dimensions—the number of carriers and dispatchable driver hours, the throughput of infrastructure like crossdocks—while truckload carriers are only just now beginning to recover their pricing power.
The inventory landscape further influences truckload demand. The Logistics Manager’s Index (LMI) for inventory levels stood at 50 in December, indicating that total inventories were essentially flat compared to November. This stability suggests that companies have accurately forecasted demand for the holiday season . However, a deeper analysis reveals a stark divergence between upstream and downstream inventory levels. Upstream facilities, often located near major port cities like Los Angeles and Savannah, registered an LMI of 57.9, signaling expansion. In contrast, downstream retailers reported a significantly lower LMI of 33.9, indicative of a highly successful holiday shopping season.
This disparity points to potential freight movement opportunities in early 2025. Upstream firms may need to replenish their inventories after possibly over-ordering in response to factors such as tariffs, while downstream retailers are likely to ramp up their inventory levels to meet consumer demand. Consequently, truckload demand could see a rebound as downstream firms seek to replenish stocks, driving increased freight movement in the coming months.
Despite these positive indicators, the truckload market remains in a state of transition. The loss of market share to intermodal transportation has contributed to a reduction in excess capacity, fostering the first signs of long-term contract rate inflation since 2022. This trend is expected to continue, albeit modestly, as shippers navigate a landscape of evolving service levels and capacity constraints.
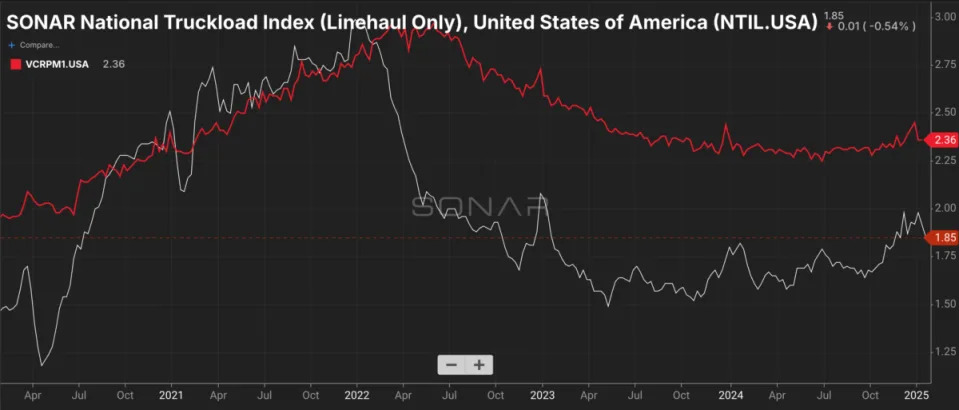
(The National Truckload Index – Linehaul is a national average truckload spot rate denominated in USD per mile, with fuel surcharges excluded. The Van Contract Rate Per Mile – Initial is the initial report of national average truckload contract rates, with fuel surcharges excluded. Chart: SONAR. To learn more about SONAR, click here ).
There are green shoots visible in some of the national pricing data, particularly the spread between contract and spot rates. A wide positive spread between contract and spot rates, where contract exceeds spot by a healthy margin, helps to ensure service levels and carrier performance: carriers won’t abandon their contracted freight only for their trucks to fetch lower rates on the spot market.
For the last three and a half months, that spread has been tightening. On October 6, the National Truckload Index – Linehaul (NTIL) stood at $1.67/mile and the contract rate was at $2.28, representing a positive spread of 61 cents or 26.7%. By January 12, the NTIL had risen to $1.92/mile but the contract rate had only climbed to $2.36/mile, for a spread of 44 cents or 18.6%. As that spread closes, there will be more situations where carriers find the spot market advantageous, which will drive rejections and eventually spot rates higher.
In terms of freight rates, Knight-Swift is positioning itself for a favorable trajectory. The company is currently seeking mid-single-digit rate increases, a step up from the low- to mid-single-digit range it pursued the previous quarter. This adjustment aligns with broader market trends; for example on the eastbound Transpacific ocean container lane, where rates have been resilient amid tight capacity and fluctuating demand.
Considering the current market conditions, the near-term prediction for truckload rates is upward. As capacity constraints persist and demand rebounds from inventory replenishment, rates are likely to continue their upward trend.
In summary, the U.S. trucking market presents a complex but promising scenario. The TL segment is navigating challenges related to capacity and demand fluctuations. Inventory dynamics indicate potential demand surges in early 2025, and freight rates are poised for an upward trajectory in the near term. Companies like Knight-Swift, with their strategic expansions and rate adjustments, are well-positioned to leverage these trends, suggesting a cautiously optimistic outlook for the trucking industry in the coming months.
The post The trucking market is still headed in the right direction appeared first on FreightWaves .