Key Takeaways
Constellation Brands ( STZ ) shares jumped in premarket trading Tuesday after Warren Buffett's Berkshire Hathaway ( BRK.A , BRK.B ) disclosed a new investment in the beer and spirits maker.
According to a Form 13-F regulatory filing released on Friday, the Omaha-based conglomerate purchased 5.6 million shares of Constellation Brands in the fourth quarter , with the stake having a market value of $1.24 billion as of Dec. 31 last year.
Some of the alcoholic beverage producer’s better-known wine brands include Meiomi, Robert Mondavi and Kim Crawford, while its Modelo Especial lager surpassed Bud Light in 2023 as the top selling beer in the U.S.
Constellation Brands shares were down 26% since the start of the year through Friday’s close amid softening consumer demand and concerns that potential tariffs on Mexican goods could force the company to raise prices. The stock was up nearly 7% at $174 in recent premarket trading.
Below, we break down the technicals on the Constellation Brands chart and identify key price levels worth watching out for.
Falling Wedge Breakout
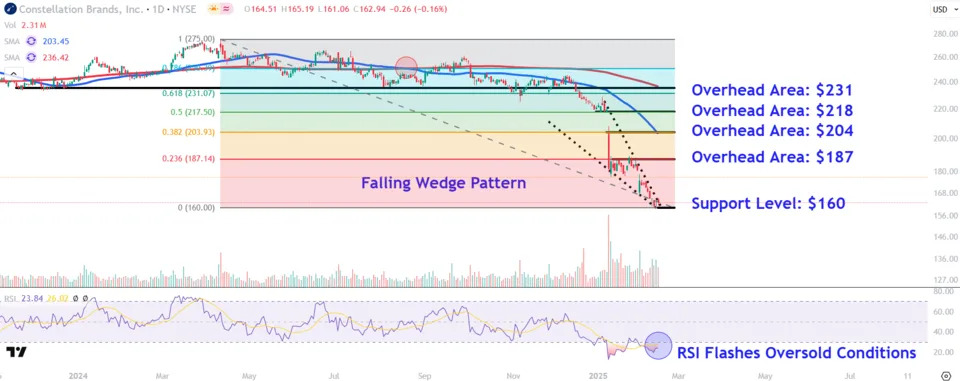
Since the 50-day moving average (MA) crossed below the 200-day MA to flash a death cross in August last year, Constellation Brands shares have trended sharply lower, with the price more recently forming a falling wedge chart pattern.
While the relative strength index (RSI) signals bearish price momentum with a reading below the 30 threshold, the indicator also points to oversold conditions, increasing the likelihood of a potential bounce.
Indeed, the stock looks set to break out above the pattern's upper trendline in Tuesday’s trading session, potentially paving the way for an upside reversal .
Let’s apply the Fibonacci retracement tool from the stock’s April 2024 high to February 2025 low, helping us locate several key overhead areas where the shares could run into selling pressure. We’ll also identify a key support level worth watching.
Key Overhead Fibonacci Levels to Track
The first overhead area to watch sits at the 23.6% Fib level around $187. This location on the chart may also provide resistance near the upper range of a brief consolidation period last month that formed within the falling wedge pattern.
Buying above this level could propel a move up to the 38.2% Fib level near $204, an area on the chart that additionally finds a confluence of resistance from the downward sloping 50-day MA and the prominent January gap’s opening price.
Further upside may fuel a move up to around $218 near the closely watched 50% Fib level. Investors could view this area on the chart as a profit-taking region near a period of early-January consolidation that preceded last month’s gap lower.
A longer-term share price recovery opens the door for a rally up to the 61.8% Fib level around $231. Investors may look for exit points near a crucial horizontal line sitting just above this area that connects a range of comparable trading action on the chart from November 2023 to December last year.
Important Support Level Worth Watching
Finally, during sell-offs , investors should keep a close eye on the $160 level. Bargain hunters may seek buying opportunities near this month’s low, which also marks the bottom of the falling wedge pattern and the stock’s lowest trading level since May 2020.
The comments, opinions, and analyses expressed on Investopedia are for informational purposes only. Read our warranty and liability disclaimer for more info.
As of the date this article was written, the author does not own any of the above securities.
Read the original article on Investopedia