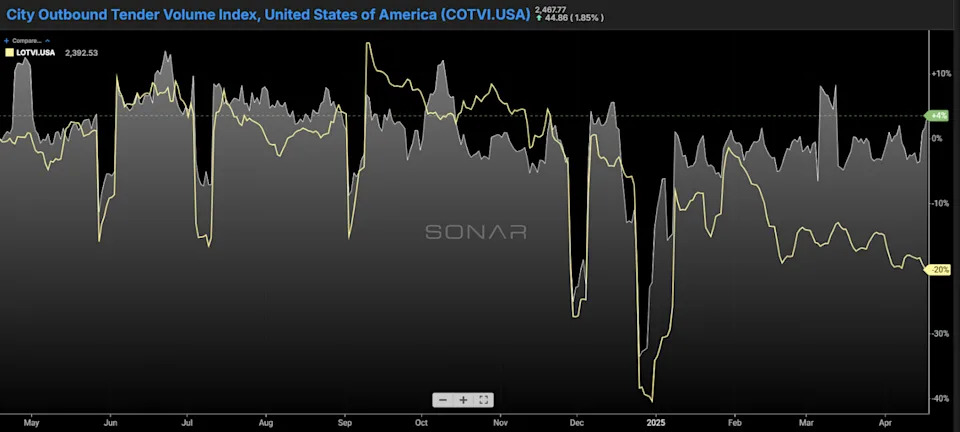
Chart of the Week: City Outbound Tender Volume Index, Long Outbound Tender Volume Index – USA SONAR : COTVI.USA, LOTVI.USA
Demand for short-haul truckloads (under 100 miles, or COTVI) has grown over the past year, while long-haul volumes have declined significantly. This shift is largely due to long-haul trucking being supplanted by intermodal transport, as shippers use containers as rolling storage in response to rising inventory costs and full warehouses. Looking at COTVI can help us decode both the economy and the truckload market.
Local or “city” freight typically involves shipments in the far upstream and downstream segments of supply chains. These include intrawarehouse movements and fulfillment orders, which make up the majority of this freight category. This mileage band can serve as a strong economic indicator – provided you understand what kind of freight is being captured. Automotive and retail activity are major drivers in this segment.
In the automotive sector, many domestic supply chains are structured so that parts manufacturers are located close to assembly plants. This proximity ensures quicker access to parts and supports efficient final assembly operations.
Retail supply chains, meanwhile, include a mix of downstream fulfillment centers and upstream distribution warehouses. The rise of e-commerce over the past decade has pushed retailers to shorten delivery times for online purchases. As a result, we’ve seen rapid growth in the number of fulfillment and distribution centers across many markets.
The traditional brick-and-mortar retail model relied on staging facilities near ports of entry, with goods then transported long distances to regional distribution centers serving physical storefronts within a 300-to-500-mile radius.
Today, many retailers operate smaller, more strategically located warehouses with targeted inventories, situated closer to the end customer to enable faster direct fulfillment. The COTVI reflects demand for this final stage of movement – closest to the end user.
Markets with the highest COTVI figures include Detroit; Elizabeth, New Jersey; Houston; and Allentown, Pennsylvania. A market like Houston likely reflects both upstream drayage activity and downstream fulfillment.
Depending on the outcome of trade negotiations – particularly with China – the COTVI could experience significant changes. A drop in drayage activity would not necessarily be a red flag for the broader economy. However, a sharp decline in downstream fulfillment-related demand would be more concerning, as it would suggest weakening consumer demand, which is the backbone of the U.S. economy.
A decline in freight demand from the Allentown market – serving the dense population corridor of the East Coast – would be especially troubling and could signal a slowdown in consumer spending.
That’s not to say a decline in Detroit should be ignored, especially given that current tariffs aim to bolster domestic manufacturing. However, that would be a more targeted signal, not a widespread economic warning.
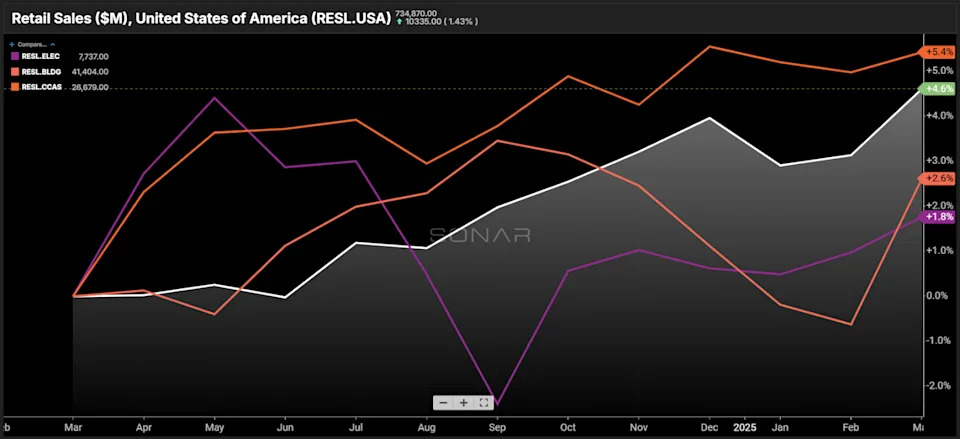
Retail sales from March surpassed expectations, with strong showings from apparel (RESL.CCAS), as well as motor vehicles and auto parts (RESL.MOTR). But many think this is a result of consumers buying in front of tariffs and will only be a temporary boost.
It is difficult to predict what will happen next, and it is not clear how long businesses will be able to hold out with sufficient inventory. Demand for loads moving less than 100 miles is not fungible with intermodal, nor is it being eroded by supply chain restructuring like many of the longer lengths of haul. It may be the cleanest economic indicator we have to stay on top of the current economy and the direct influence of tariffs.
About the Chart of the Week
The FreightWaves Chart of the Week is a chart selection from SONAR that provides an interesting data point to describe the state of the freight markets. A chart is chosen from thousands of potential charts on SONAR to help participants visualize the freight market in real time. Each week a Market Expert will post a chart, along with commentary, live on the front page. After that, the Chart of the Week will be archived on FreightWaves.com for future reference.
SONAR aggregates data from hundreds of sources, presenting the data in charts and maps and providing commentary on what freight market experts want to know about the industry in real time.
The FreightWaves data science and product teams are releasing new datasets each week and enhancing the client experience.
To request a SONAR demo, click here .
The post Look to short-haul freight as an economic bellwether appeared first on FreightWaves .